Medicare Spending Data Opens A Treasure Trove of Information
The MedPAC Data Book was released on July 19
The MedPAC Data Book provides information on national health care and Medicare spending as well as Medicare beneficiary demographics, dual-eligible beneficiaries, quality of care in the Medicare program, and Medicare beneficiary and other payer liability. It also examines provider settings—such as hospitals and post-acute care—and presents data on Medicare spending, beneficiaries’ access to care in the setting (measured by the number of beneficiaries using the service, number of providers, volume of services, length of stay, or through direct surveys), and the sector’s Medicare profit margins, if applicable. In addition, it covers the Medicare Advantage program and prescription drug coverage for Medicare beneficiaries, including Part D. Some interesting data analytics are below:
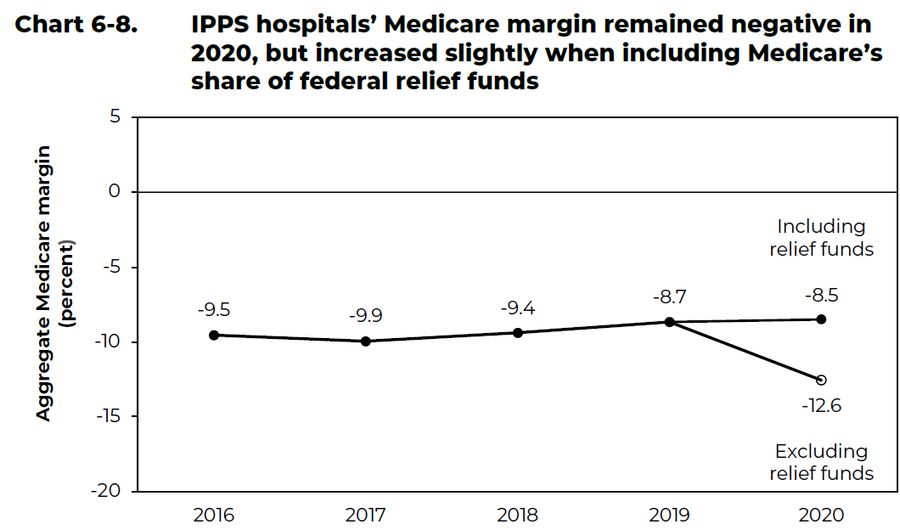
Hospitals generally lose on Medicare: IPPS hospitals’ Medicare margin remained negative in 2020, but increased slightly when including Medicare’s share of federal relief funds. Hospitals’ Medicare margin reflects the relationship between hospitals’ Medicare fee-for-service (FFS) payments and Medicare-allowable costs across inpatient, outpatient, and other services, as well as supplemental Medicare payments not tied to the provision of services (such as uncompensated care and direct graduate medical education payments).

Medicare’s projected spending growth is not driven by drug prices: Medicare spending growth is projected to be driven by growth in the number of beneficiaries (expected to increase by a little more than 2 percent per year over this period) and growth in the volume and intensity of services delivered per beneficiary (expected to rise by 3.6 percent per year). Unlike in the private health care sector, price growth is not expected to drive Medicare’s increased spending because Medicare is able to administratively set prices for many health care providers.
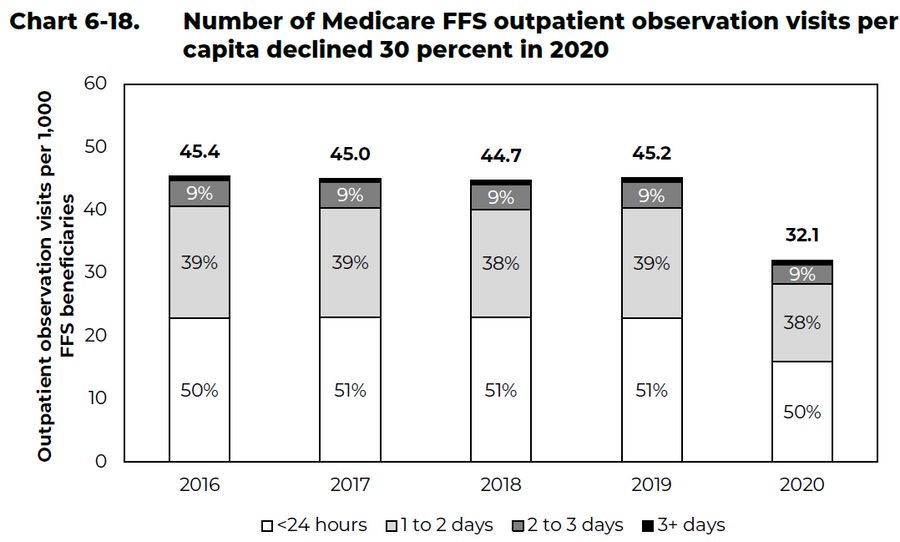
Outpatient visits fell during the pandemic: In 2020, the number of Medicare FFS outpatient observation visits per capita declined 30 percent to about 32 visits per 1,000 beneficiaries, though the distribution by length of stay remained similar to prior years. The decline in observation visits in 2020 reflects the COVID-19 public health emergency and is similar to the decline in non-COVID emergency room visits (data not shown).
