Share of Prescription Drug Spending in 2020 Lower Than Spending for Hospital and Physician Services
Growth in spending for hospital care and physician and clinical services in 2020 outpaced prescription drugs
The Centers for Medicare & Medicaid Services' (CMS) National Health Expenditure Accounts (NHEA) are the official estimates of total healthcare spending in the United States. These annual reports provide annual health spending data in the U.S. by type of service delivered, such as hospital care, physician and clinical services, and prescription drugs, as well as the source of funding for those services, including private health insurance, Medicare, and Medicaid.
The 2020 NHE data was recently released by CMS. Total U.S. healthcare spending in 2020 reached $4.1 trillion, a 9.7% increase from 2019 [1]. The increase in health spending was primarily driven by a rise in federal health expenditures for COVID-19 funding. Total Medicaid spending accelerated in 2020, increasing 9.2% to $671.2 billion, while private health insurance spending experienced a 1.2% decline. Medicare spending increased at a slower rate in 2020 at 3.5%, compared to 6.9% in 2019.
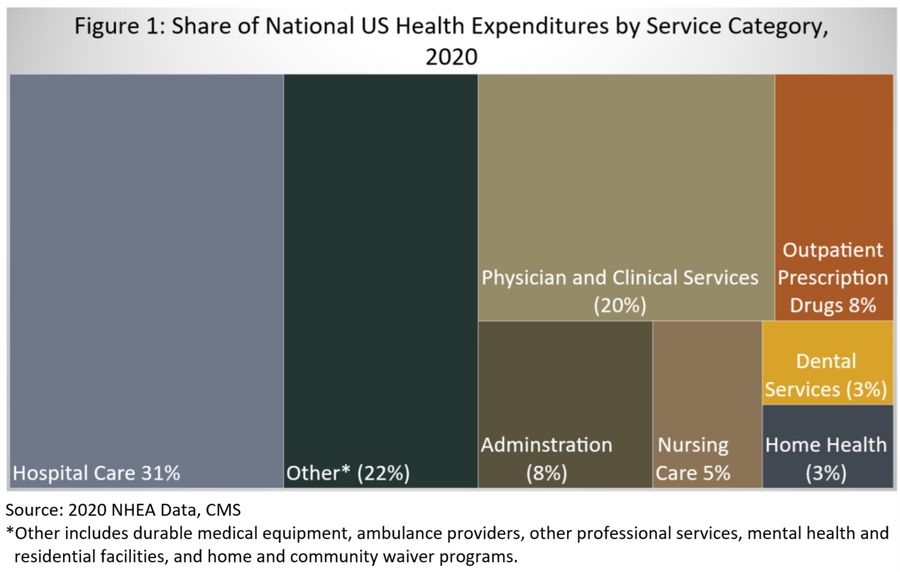
NHEA also reports the share of total U.S. healthcare spending by service category (Figure 1), which is critical for understanding which services drive total health expenditures. In 2020, hospital care and physician and outpatient services accounted for 31% and 20% of total spending, respectively, while outpatient prescription drugs accounted for only 8% of total spending. Dental services, nursing care, and home health services, combined, accounted for 11% of total expenditures.

Growth in spending for hospital care and physician and clinical services in 2020 also outpaced prescription drug spending. Spending for hospital care increased by 6.4%, and 8% for physician and clinical services, compared to only 3% for outpatient prescription drugs. Prescription drug share of total healthcare spending has decreased over time, and at a faster rate than hospital care and physician and clinical services. Between 2015 and 2020, the share of prescription drug spending decreased by 15%, while hospital care and physician services only declined by 1.6% and 2.5%, respectively.
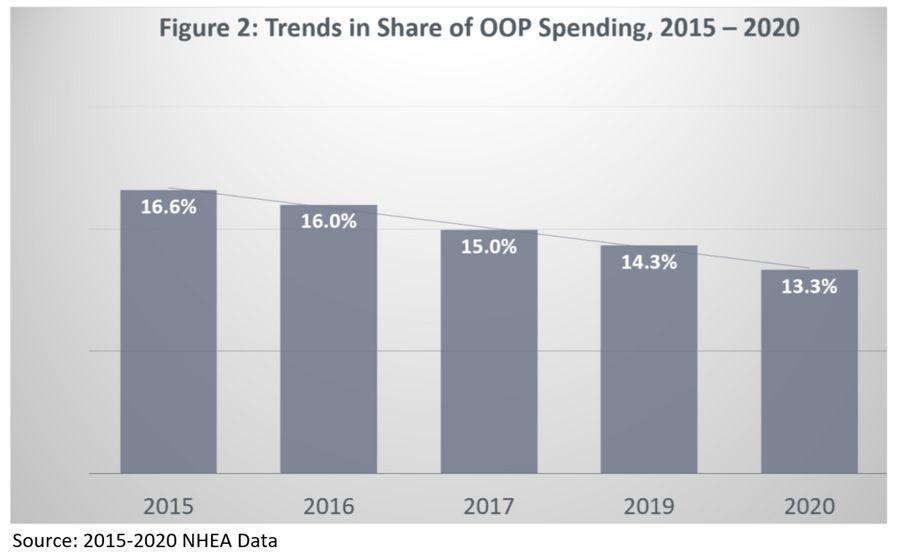
The slow growth in prescription drug spending, particularly between 2019 and 2020, has been driven by a decline in consumer out-of-pocket (OOP) spending. The share of total OOP spending among total prescription drug expenditures has decreased at a consistent rate in recent years, from 16.6% 2015 to 13.3% in 2020 (Figure 2).

Prescription drug costs are frequently cited as the dominant driver of overall US healthcare costs, however NHEA data reveal a different story. While high-cost specialty drugs incur higher private and public spend, the share of generic drugs has increased substantially over time, from 78% of all dispensed prescriptions in 2010 to 90% in 2020 [2]. The average amount consumers paid out-of-pocket per prescription drug has also been declining, from $10.3 in 2015 to $9.8 in 2020, due to lower generic costs. The average amount paid per generic drug among Medicare beneficiaries was even lower in 2020, at $6.1 per prescription.
While several proposals have been developed by policymakers to lower the cost of prescription drugs, policies to curtail growth in hospital and outpatient care warrant similar attention. Healthcare spend on hospital and physician services has a greater impact on national health expenditures than outpatient prescription drugs, and is increasing at faster rates.
References
[1] Centers for Medicare & Medicaid Services. National Health Expenditure Data, 2015-2020; NHEA Summary Sheet.
[2] IQVIA. The Use of Medicines in the U.S. Spending and Usage Trends and Outlook to 2025. Institute Report, 2021.