Top 20 Medicare Part B Drug Price Trends
This article will focus on the role of Part B drug prices and how they have changed over time.
MedPAC recently released the 2023 version of the MedPAC Data Book. This resource provides information on national health care, Medicare data on spending, and Medicare beneficiary dynamics among many other data points relative to the Medicare population. MedPAC’s primary role is to advise the US Congress on issues affecting the administration of the Medicare program and the development of the annual Data Book was at the suggestion of congressional staff.
In the current Data Book report, MedPAC reports that Medicare spent approximately $43 billion (gross spend which includes Medicare program payments and beneficiary cost share) on separately paid Part B drugs in 2021, a 5% increase over 2020. Spend in Part B is concentrated, with the top 20 drugs accounting for 53% of total Part B drug spend in 2021. It is important to note that spend is composed of two separate elements – changes in utilization and price which combine to create total spend. This article will focus on the role of Part B drug prices and how they have changed over time.
Figure 1 below is adapted from the MedPAC report and provides an overview of Medicare spend and average percentage changes in average sales price (ASP) across time for the top 20 Part B drugs ranked by total Medicare spend in 2021. ASP reflects changes in net brand drug price which may include discretionary price concessions such as commercial contracts, GPO contracts, prompt pay discounts, and specialty pharmacy fees.
Average annual ASP changes seen in Figure 1 are noted for two differing time periods and contrasted with a Consumer Price Index (CPI) metric which offers a relative measure of Part B drug net price changes to general price inflation in the same time period.
Figure 1: Change in Manufacturer Net Prices for the Top 20 Part B drugs, 2015 - 2023
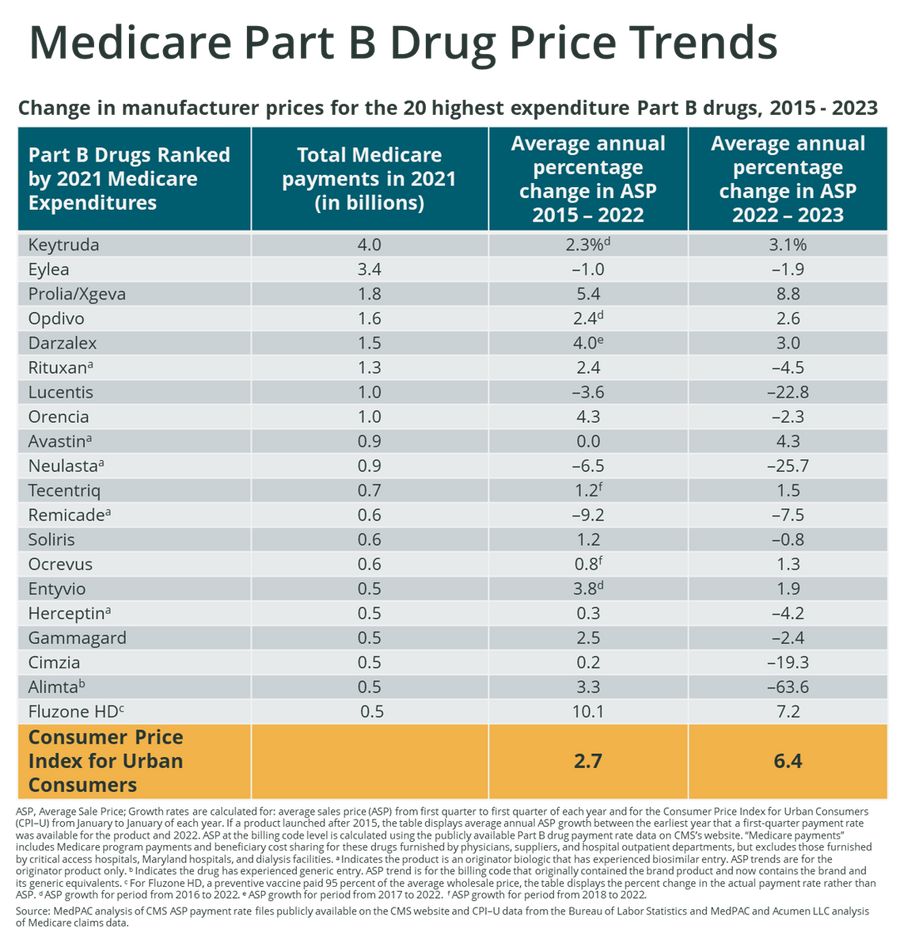
ASP Net Price Changes of Top 20 Part B Drugs compared to CPI
In all time periods evaluated by MedPAC, the majority of top 20 Part B brands experienced changes in ASP price which were below the general rate of inflation. A summary of each time period is as follows:
2015 – 2022: 70% of the top 20 Part B drugs had changes in ASP which were below CPI in the same period of time
2022 – 2023: 90% of the top 20 Part B drugs had changes in ASP which were below CPI in the same period of time
Market events which likely drove many of these ASP price changes include the introduction of generics for Alimta and biosimilar versions of brand products (Rituxan, Lucentis, Avastin, Neulasta, Remicade, and Herceptin) which previously enjoyed patent protection.
In addition to these loss of exclusivity (LOE) events, market competition was a factor which had an impact on net prices. As seen in both time periods, competition between Eylea and Lucentis in the ophthalmic market resulted in in ASP changes which were below CPI for the manufacturers of both drugs. In addition to competition with Eylea, Lucentis was also significantly impacted by the approval of a biosimilar competitor in late 2021. In the autoimmune therapeutic category, Orencia and Cimzia also experienced ASP price changes below CPI in most cases; the exception being Orencia ASP growth exceeding CPI in the 2015 – 2022 time period. Finally, the IVIG market also appears to be price competitive as Gammagard ASP changes lagged CPI in both time periods which were evaluated.
Percentage of Top 20 Part B Drugs with ASP Decreases
The majority of top 20 Part B drugs had an increase in ASP between 2015 – 2022, with only 20% of brands showing a decrease in ASP. This trend was reversed in 2022 – 2023 as the majority of top 20 Part B drugs had decreases in net price as measured by ASP. Details by year are seen below:
2015 – 2022: 20% of the top 20 Part B drugs showed a percentage decrease in ASP
2022 – 2023: 55% of the top 20 drugs experienced a decrease in ASP
The same market events noted previously were key contributors to the decrease in ASP across certain Part B drugs. Both LOE and market competition served as moderating forces on the ability of manufacturers to realize net price increases.
When considering only those drugs which did not experience a direct LOE event, 25% of the top 20 had decreases in ASP in 2022 - 2023 which may be attributed to market competition.
Summary
The market for physician-administered Part B drugs is often considered to be void of direct mechanisms by which CMS can control prices set by manufacturers. However, due to the ASP reimbursement method used in Part B, CMS is able to reference price concessions given by manufacturers to the commercial market and apply these to Medicare reimbursement of Part B drugs. Thus, the use of reference pricing through ASP allows CMS to obtain price concessions despite the fact they do not apply any direct utilization management controls to the Medicare fee-for-service market.
Net pricing for the top 20 Part B drugs in the time periods evaluated have been materially impacted by LOE events and competition. In the case of these drugs for the time periods of interest, market forces have been effective in limiting net price increases among the brands which account for over half of total Part B drug spend. Further analysis is warranted to determine if a similar trend is seen outside of the top 20 Part B drugs.
Given the recent introduction of price negotiation for select Part B drugs in the Inflation Reduction Act, manufacturers should expect heightened price competition in select therapeutic classes for Part B drugs when these changes take affect in 2028.
Net pricing in the physician-administered drug market is more dynamic than many assume. As the biopharmaceutical industry pipeline continues to generate innovation in new physician-administered brands, these products may be subject to competitive market forces in certain classes. Contact us for more information If your organization has questions on the latest net price trends by brand, therapeutic class, or manufacturer in the physician-administered drug market.