Cost-to-Charge Ratios: Trends Report
Hospitals Mark Up Services and Treatments to Billed to Medicare
Hospitals Mark Up Services and Treatments to Billed to Medicare Increasingly Over Time
Hospitals bill charges to Medicare for patient care based on several factors, including payer mix, utilization, and hospital capacity. Markups are not regulated at the federal level, and not all hospitals have the same cost structure. As a result, there is significant variation in how hospitals set their prices for services.1
A hospital’s total charges for services do not reflect either the Medicare payment received by the hospitals or the total inpatient cost of care. The Centers for Medicare and Medicaid Services (CMS) pays hospitals for inpatient stays under the Inpatient Prospective Payment System (IPPS). Under IPPS, Medicare pays hospitals a prospectively determined rate for each Medicare admission. Each patient is categorized into a diagnostic category (MS-DRG).2 Hospitals receive a prospectively set amount for the MS- DRG that is only somewhat influenced by the services provided and total expenses of patient care. As a result, the MS-DRG may not adequately capture the total cost for an inpatient stay. Additionally, CMS’ payment rates for MS-DRGs are based on Medicare claims data from prior years, resulting in a lag between current Medicare patient costs and the reimbursement amounts.
CMS estimates payments by using hospital-specific cost-to-charge ratios (CCRs) derived from each hospital's Medicare cost report.3 CCRs are calculated as a hospital’s total expenses divided by its total charges.4 The closer a CCR is to 1, the smaller difference between the hospitals’ charges and the total expenses incurred, and a ratio closer to 0 indicates a higher markup of costs.
Data from the Centers for Medicare and Medicaid Services (CMS) Impact Files were used to obtain hospital-specific CCRs from Fiscal Year (FY) 1994 - 2020 to examine whether total hospital costs relative to charges are increasing or decreasing over -me. CCRs are influenced by hospital charging practices, therefore this ratio can be used to evaluate trends in hospital markups and changes in hospital charges for services.1
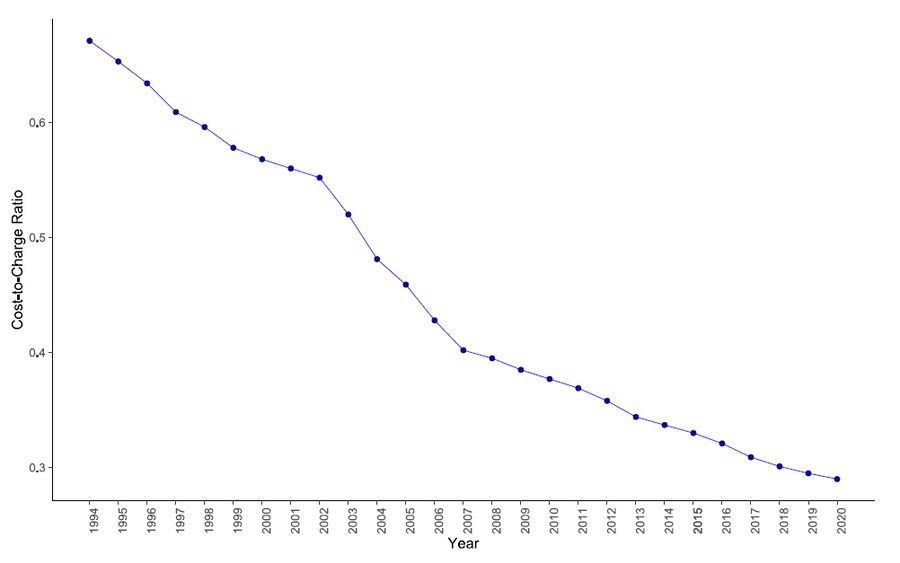
From FY 1994 to FY 2020, there was a significant decline in annual hospital CCRs (Figure 1). Nationwide, the average hospital CCR decreased by 54% percent, from 0.70 in 1994 to 0.32 in 2020 (Figure 2). Reasons for the increasing markup practice are not assessed here but could include Medicare reimbursement methods (which necessitate marking up costs), an aging population (which sways payer mix towards Medicare patients), or changing hospital cost structures.
Figure 1: Trends in Cost-to-Charge Ratios, FY 1994 – FY 2020
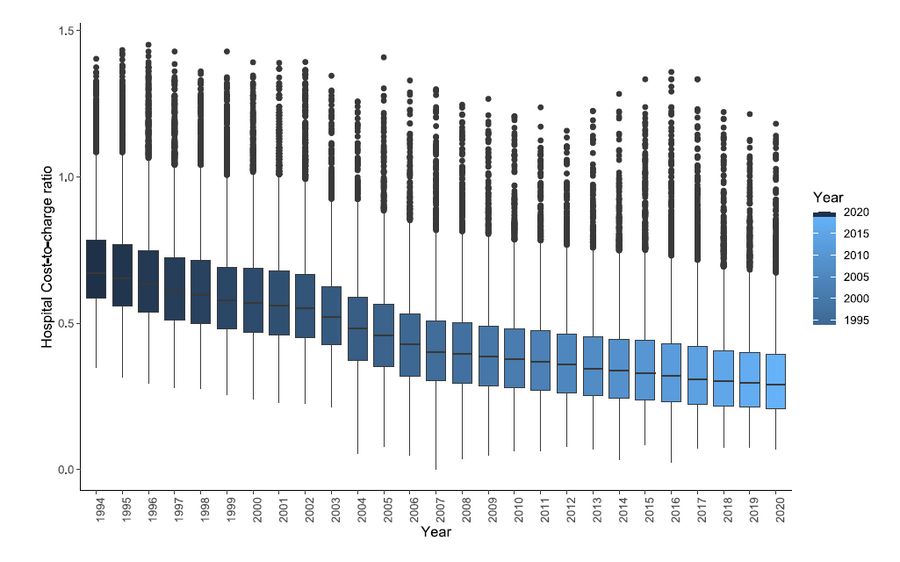
Figure 2: Trends in Average Cost-to-Charge Ratios, FY 1994 – FY 2020
The trend in declining CCRs is consistent for hospitals in urban & rural areas
The trend in declining CCRs across hospitals is consistent across urban and rural areas (Figure 3) and by geographic region (Figure 4).
Figure 3: Trends in Cost-to-Charge Ratios by Rural-Urban Classification, FY 1994 – FY 2020
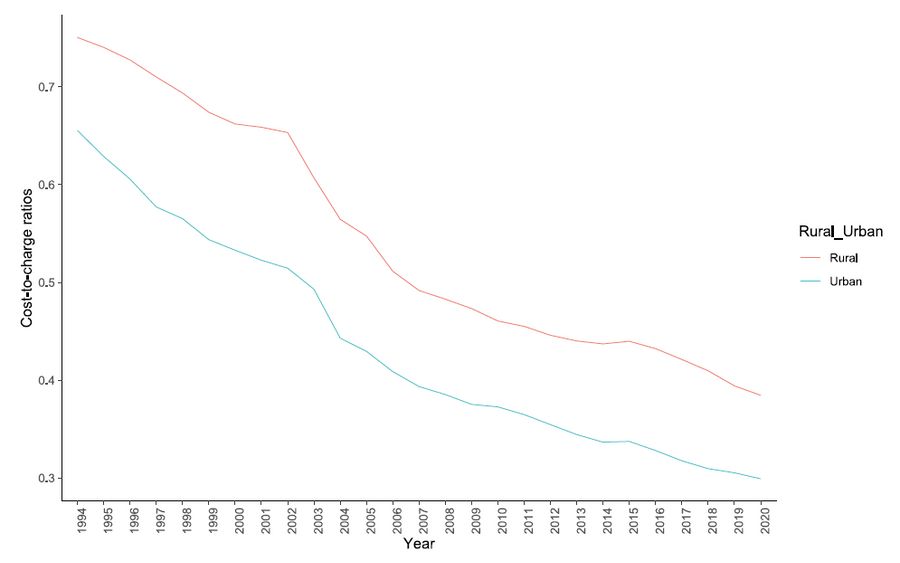
Compared to hospitals in urban areas, average CCR among hospitals in rural areas remained consistently higher over time. In 2020, the average CCR among hospitals in rural areas was 0.39, versus hospitals in urban areas with a CCR of 0.30.
Figure 4: Trends in Average Cost-to-Charge Ratios by Geographic Region and Rural-Urban Classification, FY 1994 – FY 2020
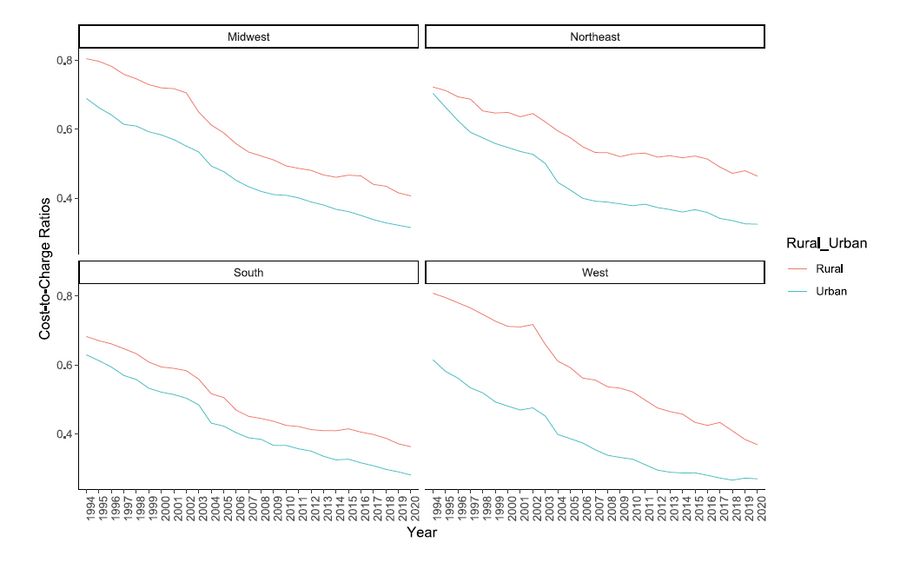
In 2020, the West region had the lowest CCR (0.28 ), followed by South (0.31). Average CCR for the Midwest and Northeast was 0.34. From FY 1994 to 2020, the West experienced the greatest percent decrease in average CCR (-59% decrease), followed by Midwest (-55%), South (-53%) and Northeast (-51%).
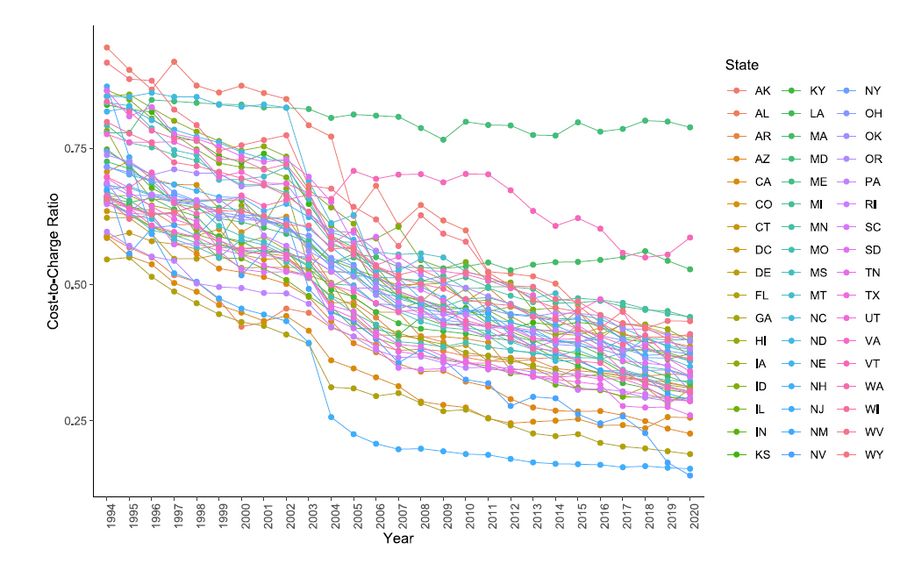
Despite the overall decline in CCR at the national-level, there is variation in CCR trends at state-level, from 1994-2020 (Figure 5).
Figure 5: Trends in Average CCR by State, FY 1994 – FY 2020)
In 2020, the West region had the lowest CCR (0.28 ), followed by South (0.31). Average CCR for the Midwest and Northeast was 0.34. From FY 1994 to 2020, the West experienced the greatest percent decrease in average CCR (-59% decrease), followed by Midwest (-55%), South (-53%) and Northeast (-51%).
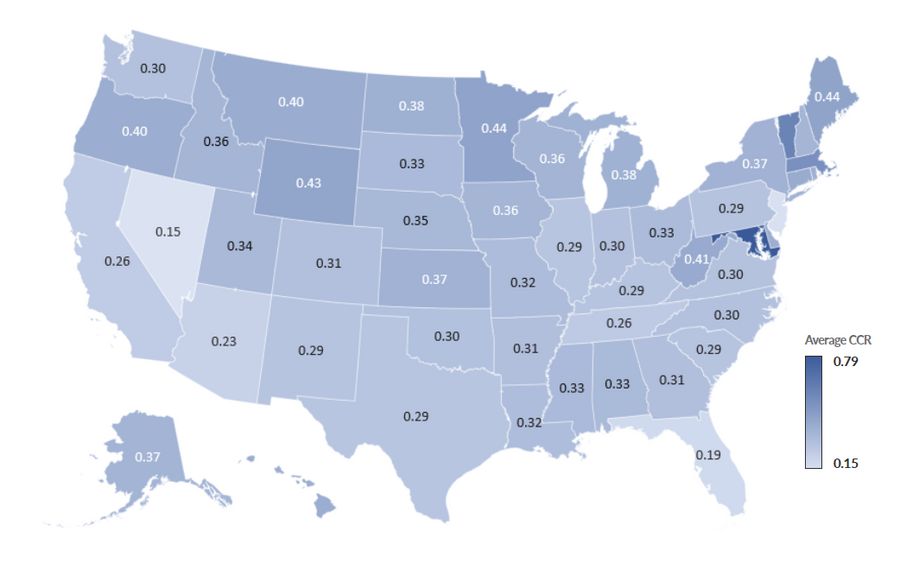
Variation in average CCRs at the state-level in 2020 is further presented in Figure 6, below.
Figure 6: State-level Average Cost-to-Charge Ratio, FY 2020
From 1994 – 2020, there was a significant decline in hospital-specific cost-to-charge ratios across the U.S. This trend in increasing markups, and variation across hospitals over time may be due to Medicare IPPS reimbursement methods that vary amounts paid based on estimated costs.
As mentioned above, CMS estimates costs by using hospital-specific CCRs. CMS’ method of calculating payment rates may lead to inaccurate cost estimates and inadequate reimbursement for patient care costs. Since Medicare payment rates are set based on claims data from prior years, this results in a payment lag. The slow rate growth in Medicare spending and subsequent payments poses financial challenges to hospitals, and providers must charge more to recoup total hospital costs and maintain overall hospital revenues above expenses.1
Under IPPS and CMS’s current reimbursement policy, Medicare payment rates lead to inaccurate cost estimates and inadequate reimbursement for hospitals. Data indicate that hospitals are increasing their charges over time for other services, possibly to reduce financial losses from Medicare reimbursement.
References
Bai, G. and G.F. Anderson. Extreme markup: the fifty US hospitals with the highest charge-to-cost ratios. Health Affairs, 2015. 34(6): p. 922-928.
CMS. Fiscal Year (FY) 2019 Medicare Hospital Inpatient Prospective Payment System (IPPS) and Long-Term Acute Care Hospital (LTCH) Prospective Payment System Final Rule (CMS-1694-F). 2018 April 21, 2020]; Available from: https://www.cms.gov/newsroom/fact-sheets/fiscal-year-fy-2019-medicare-hospital-inpaOent-prospecOve-paymentsystem-ipps-and-long-term-acute-0.
Coomer, N.M., et al. Using Medicare cost reports to calculate costs for post-acute care claims. 2017.
Shwartz, M., D.W. Young, and R. Siegrist. The ratio of costs to charges: how good a basis for estimating costs? Inquiry, 1995: p. 476-481.