Issue Brief: Medicare Reimbursement for New Oncology Therapies and Geographic Access to Care
Qualia Bio analysis estimates that diffuse large B-cell lymphoma (DLBCL) patients may be enduring unnecessarily high travel burden as providers deal with insufficient inpatient reimbursement from Medicare. Medicare patients generally have less broad access than commercially insured patients...
Summary
Medicare reimbursement for new oncology therapies generates geographic access concerns for patients
Qualia Bio analysis estimates that diffuse large B-cell lymphoma (DLBCL) patients may be enduring unnecessarily high travel burden as providers deal with insufficient inpatient reimbursement from Medicare. Medicare patients generally have less broad access than commercially insured patients, and patients in certain regions are expected to have heightened geographic access barriers.
Medicare inpatient reimbursement creates challenges for hospitals administering chimeric antigen receptor T-cell (CAR T-cell) therapy. Even after temporary payments for new technology and adjustments available for high cost cases, hospitals may have considerable unreimbursed costs on each Medicare CAR T-cell case. Unstable and insufficient reimbursement is a key contributor to the following access trends:
Fewer than expected Medicare patients receive CAR T-cell therapy
The average age of diagnosis for DLBCL is mid-60s, however, the majority of patients receiving CAR T today are commercially insured.
PPS-exempt hospitals treat a disproportionate number of Medicare patients
Greater than 40% of CAR T claims submitted to Medicare between 2018 and the first half of 2019 were from just 6 hospitals that are exempt from the Inpatient Prospective Payment System (IPPS), suggesting that IPPS reimbursement is a barrier to broader adoption and treatment in the Medicare population.
A high number of Medicare CAR T patients are referred to clinical trials
Around half of Medicare claims between 2018 and the first half of 2019 were clinical trial cases. The high proportion of clinical trial cases implies that Medicare reimbursement has been inadequate, encouraging providers to refer patients to clinical trials in which the cost of the therapy is borne by the manufacturer. Given that clinical trial participation is restricted by factors such as trial location and eligibility, this approach is not a sustainable option for long-term patient access.
Medicare reimbursement challenges contribute to significant geographic disparities in access to CAR T-cell therapies
Medicare patients may travel over 50% further (100 miles on average) compared to commercially insured patients (66 miles on average) to access CAR T-cell therapy. Average distance traveled in certain states may be starkly different for Medicare and commercially insured patients, including Oklahoma (230 miles vs. 56 miles), Arkansas (300 miles vs. 152 miles), and Mississippi (230 miles vs. 87 miles). Increased travel has been associated with relatively poor patient outcomes, particularly in oncology.
Medicare IPPS reimbursement for CAR T-cell therapies may be producing unintended geographic barriers to patient access. If reimbursement for CAR T does not swiftly adapt, Medicare patients may continue to suffer undue travel burdens and limited access to CAR T-cell therapies.
Reimbursement challenges contribute to geographic disparities in access to CAR T-cell therapies
Figure 1: Commercial Scenario, Estimated Distance (miles) to the Nearest CAR T-cell Therapy Administering Center for Large B-Cell Lymphoma Patients by County and State
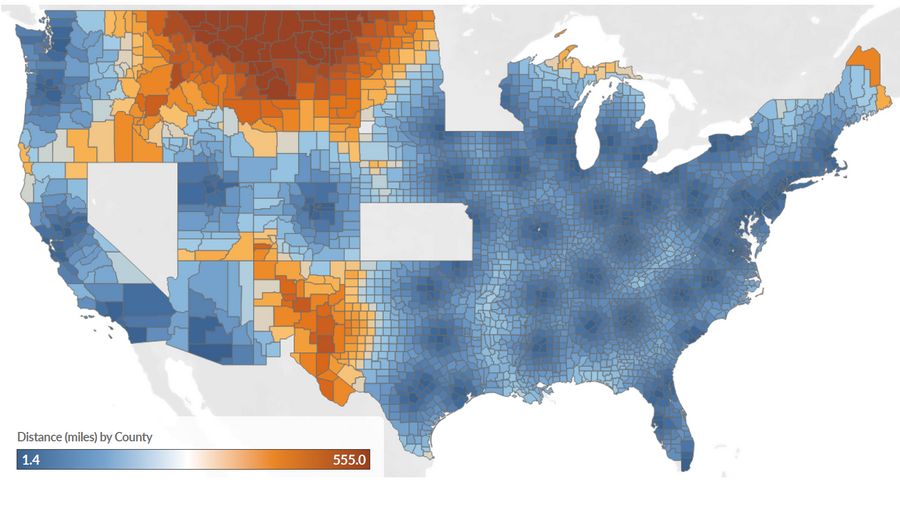
Figure 2: Medicare Scenario, Estimated Distance (miles) and Difference in Distance* Compared to Commercial Scenario to the Nearest CAR T-cell Therapy Administering Center for Large B-Cell Lymphoma Patients by County and State
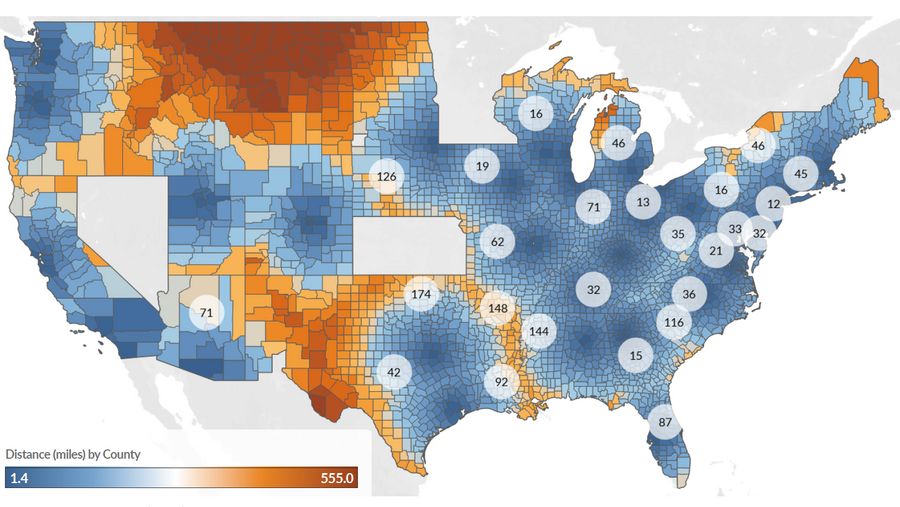
*State average difference (miles) between the Commercial and Medicare scenarios shown in circles for states with difference > 10 miles. Incidence data represent a 5-year average incidence count from 2011-2015 for every county except for those in the states of Kansas, Minnesota, and Nevada because incidence data were not supplied to the SEER registry. Our analysis also excluded Alaska and Hawaii because travel in these states is not consistently road-based. The analysis was limited to counties with at least one incident NHL case on average from 2011 through 2015.
A source of geographic variation in access to care is emerging for CAR T-cell therapies. Insufficient Medicare reimbursement has resulted in delivery via providers concentrated in few regions. Using geographic information system methods, we estimated time (minutes) and distance (miles) to the nearest certified center for diffuse large B-cell lymphoma (DLBCL) patients based on CAR T-cell therapy sites listed on YESCARTA® and KYMRIAH® websites†, county-level incidence data,1 and Medicare claims.‡
All certified sites from YESCARTA® and KYMRIAH® served as a proxy for access to CAR T-cell therapy for commercially insured patients. Of these sites, sites with at least one Medicare claim (from FY2018 through the first two quarters of 2019) were assumed to represent access for Medicare patients. This approach is conservative as access for Medicare patients is likely better represented by providers with experience treating several Medicare patients with CAR T-cell therapy each year.
Patients were assigned to US counties based on DLBCL incidence data from the State Cancer Profiles, a data program developed by the National Cancer Institute (NCI) and the Centers for Disease Control and
Prevention.1 Patients’ residence was assumed to be at the county population centroid. Travel distance and times were calculated based on the shortest driving route from each county population center to the nearest destination point assuming average traffic levels.
Table 1. Estimated Distance (miles) and Time (minutes) to the Nearest CAR T-cell Administering Site for Medicare and Commercial DLBCL Patients*
Weighted† Average Distance (miles) | Weighted† Average Time (minutes) | Average Distance (miles) Across States | Average Time (minutes) Across States | |
|---|---|---|---|---|
Medicare Scenario | 100 | 103 | 139 | 137 |
Commercial Scenario | 66 | 72 | 98 | 100 |
Absolute Difference (Medicare - Commercial) | 35 | 31 | 41 | 37 |
Difference (as % of Commercial Scenario) | 51.5% | 43.1% | 41.8% | 37.0% |
Numbers may not sum due to rounding. DLBCL: diffuse large B-cell lymphoma *Medicare patients were assumed to have access to sites with any Medicare claims to date based on The Moran Company analysis of Medicare Standard Analytical File from four quarters 2018 – two quarters 2019. Commercial patients were assumed to have access to any site listed on the YESCARTA® and KYMRIAH ® websites as of January 2019. †Weighted by the county-level incidence of DLBCL
Medicare patients were estimated to travel over 50% further compared to commercial patients on average
The estimated weighted average distance and time to the nearest Medicare center** was 100 miles and 103 minutes. These travel time and distance estimates contrasted with a scenario in which patients were able to access all sites listed on the YESCARTA ® and KYMRIAH ® websites. Assuming commercial patients can access these sites, the weighted average distance traveled for commercial patients was estimated to be 66 miles, compared to 100 miles for Medicare patients (a 35% decrease, Table 1).
†As of January 30, 2019 ‡The Moran Company analysis of Medicare Standard Analytical File from four quarters 2018 – two quarters 2019 §Weighted by DLBCL patient incidence by county **A center was considered an active Medicare provider if it had at least 1 Medicare claim during the analysis period
Table 2. Top 10 States with the Largest Difference in Travel Distance (miles) and Time (minutes) Between Medicare and Commercial Patients
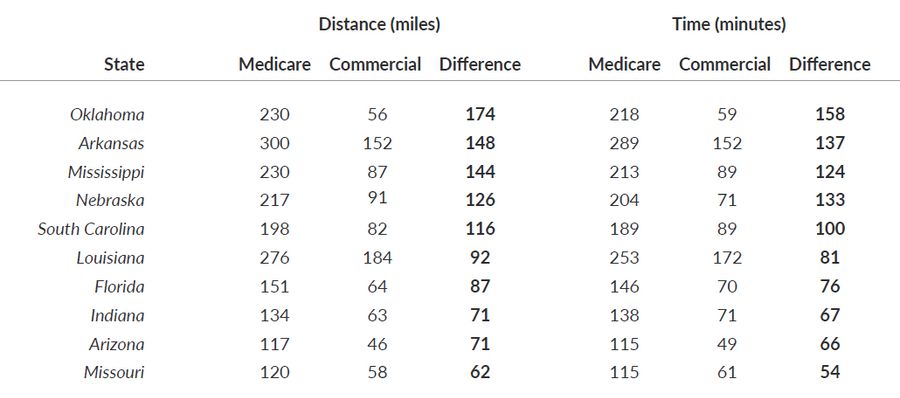
Average distance traveled in several states showed stark differences between Medicare and Commercial scenarios, including Oklahoma (230 miles under the Medicare scenario versus 56 miles under the Commercial scenario), Arkansas (300 versus 152 miles), and Mississippi (230 versus 87 miles) (Table 2 & Figure 1). Travel distance and time are widely recognized factors impacting the accessibility of medical services, patients’ willingness to receive treatment, patient outcomes, and patient quality of life.2-6
Medicare inpatient reimbursement creates challenges for hospitals administering CAR T-cell therapy
The Medicare program has attempted to address geographic disparities from several angles, including the use of wage indices in reimbursement methods and developing rural health initiatives.7,8 Nonetheless, geographic disparities persist. Further, recent approvals for novel therapies in the inpatient setting challenge Medicare’s legacy reimbursement systems. Medicare’s methods of reimbursement are largely based on historical claims data. While CMS prospectively sets Medicare Severity-Diagnosis Related Group (MS-DRG) payments annually, the agency bases these payments on Medicare claims data accrued over a historical two to three-year period. This process results in a payment lag, or discrepancy between the current claims profile and CMS-estimated claims profile.
As such, the program’s adaptability to high-value innovative therapies has been stymied. For instance, the inpatient prospective payment system (IPPS) bundles payments according to MS-DRGs. The payment amounts for MS-DRGs in a given year are based on use, cost and charge data submitted by hospitals over the preceding two years. When multiple services are mapped to the same DRG, those services with higher frequency tend to weigh more heavily into the payment calculation. Consequently, an MS-DRG payment amount is often 1) not reflective of current resource utilization and 2) not specific to certain procedures.
The issue of delayed Medicare reimbursement updates is amplified by inadequate average payment amounts to hospitals under IPPS. According to the Medicare Payment Advisory Commission (MedPAC), in 2017, hospitals lost an average of 9.99 percent on Medicare patients, and the projected Medicare loss was forecast to increase to 11 percent in 2019.10 The loss margin for new therapies, such as CAR T-cell therapy, is estimated to exceed the average loss margin. Under IPPS, Medicare reimburses all costs related to CAR T-cell infusion under MS-DRG 016, which has historically been dedicated to autologous stem cell transplantation. The Moran Company estimated the standardized payment amount for MS-DRG 016 as $43,016 in 2018 (the base Medicare reimbursement).11
Hospitals have two formal methods to supplement the base MS-DRG payments: New Technology Add-On Payments (NTAPs), which are time limited, and outlier payments, a permanent mechanism for high-cost cases. Two CAR T-cell therapies, YESCARTA® and KYMRIAH®, were approved for NTAP payments, which are intended to “smooth market entry”12 by paying for part of the cost of novel and effective treatments during the years that it takes for the MS-DRG claims to reflect the costs of the new therapy. CMS has set the maximum NTAP payment for FY2019 at 65% of the cost of the technology, or $242,450 for either CAR T-cell therapy on the market.13 The outlier payment may reimburse a portion (80% after a cost threshold is met) of the remaining uncovered costs. The sum of the base MS-DRG, a portion of the new technology cost, and a portion of remaining excess costs often leaves hospitals with considerable unreimbursed amounts on each Medicare CAR T-cell case. When NTAP payments for YESCARTA® and KYMRIAH ® expire on September 30, 2020, hospital losses will increase further unless CMS acts to create an alternative payment mechanism. An example Medicare payment, with and without NTAP, to an inpatient hospital for CAR T-cell therapy is shown in Table 3 and Figure 3.
Figure 3. Hypothetical Example* Medicare FY2020 IPPS Reimbursement for CAR T-cell Therapy With (A) and Without (B) NTAP
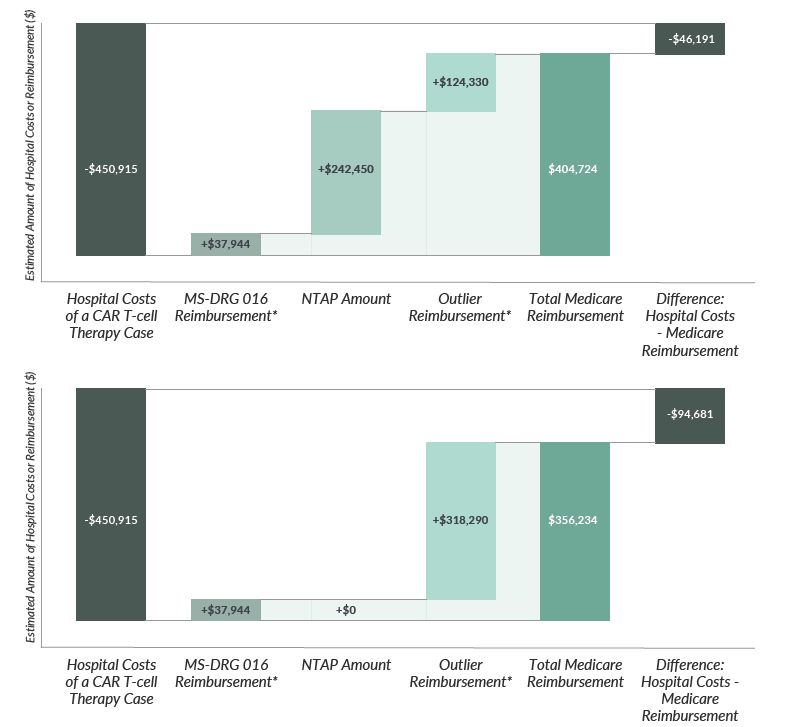
*Example reimbursement for a hospital with a wage index of 0.89; not representative of any particular hospital or any particular patient case. Individual hospitals' reimbursed amounts typically vary considerably from another hospital's reimbursement due to several factors.
Table 3: Example FY2020 Inpatient Prospective Payment Reimbursement for a CAR T-cell Therapy, With and Without New Technology Add-on Payment ($2020)
Hospital Costs of a CAR T-cell Therapy Case | With NTAP | Without NTAP |
|---|---|---|
Hospital Costs of a CAR T-cell Therapy Case | $450,915 | |
MS-DRG 016 Reimbursement | $37,944 | $37,944 |
NTAP Amount | $242,450 | N/A |
Outlier Reimbursement | $124,330 | $318,290 |
Total Medicare Reimbursement | $404,724 | $356,234 |
Difference: Hospital Costs - Medicare Reimbursement | -$46,191 | -$94,681 |
Reimbursement challenges are shaping the CAR T-cell access landscape for Medicare patients
Insufficient Medicare IPPS reimbursement for CAR T-cell therapies has created an access disparity between commercially insured patients and Medicare patients, resulted in geographic disparities, and driven a disproportionate number of Medicare cases to Medicare Prospective Payment System (PPS)- exempt hospitals, and created persistent reliance on clinical trials.
In an analysis of the FY 2018 MedPAR data, the American Society for Transplantation and Cellular Therapy (ASTCT) found that the volume of CAR T cases is lower than expected, concentrated among a few PPS-exempt hospitals, and the number of clinical trial cases is high.14
Fewer than expected Medicare patients receive CAR T-cell therapy
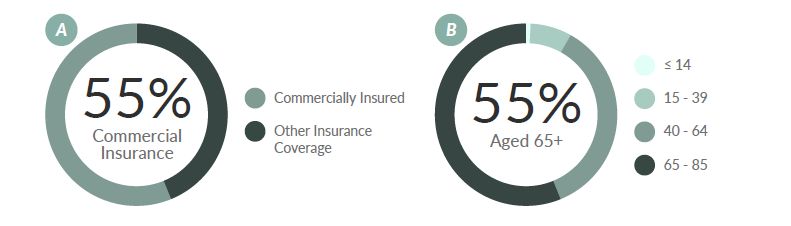
An estimated 22,789 patients are living with DLBCL in the US.*,15 CAR T-cell therapies have demonstrated clinical benefits in the adult DLBCL population. Recent analysis of 735 CAR T claims by Vizient revealed that the majority of patients (55 percent) were commercially insured (Figure 2a).16 This proportion is in contrast with the age distribution of DLBCL, for which the average age at the time of diagnosis is mid-60s.17,18 Based on the DLBCL incidence age distribution (Figure 2b), the majority of patients would be expected to be insured by Medicare. The conflicting allocations between insurance coverage and age points to probable access issues for Medicare patients.
*Calculated by multiplying the national, age-specific (aged 65 and older, from the (last available) 2015 SEER registry) 2-year NHL and DLBCL prevalence rates by the US population aged 65 and older as of December 2018.2
Figure 4. (a) Distribution of CAR T-cell Therapy Patient Insurance Coverage16 and (b) Diffuse Large B-cell Lymphoma Incidence (1973–2015) by Age Group (years)17,18
PPS-exempt hospitals treat a disproportionate number of Medicare patients
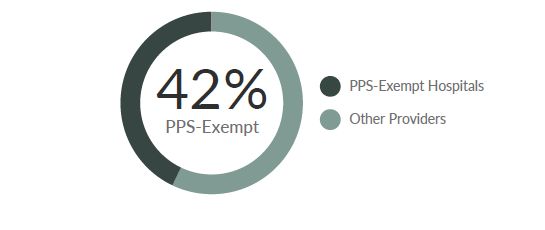
Certain cancer hospitals are exempt from the IPPS payment methodology. Instead, Medicare pays these hospitals based on their reasonable costs, subject to a ceiling. The MedPAR data comprised of 348 total CAR T cases; of these, only 58 percent were submitted by IPPS hospitals.14 The remaining 42 percent of the cases were provided by just 6 out of 11 PPS-exempt hospitals (Figure 3).
Figure 5. Distribution of CAR T-cell Therapy Administration by Inpatient Hospital Type14
A high number of Medicare CAR T patients are referred to clinical trials ASTCT has also chronicled on Medicare CAR T-cell therapy claims in response to Medicare proposed coverage and payment options.19,20 They report that about 34%-54% of claims between 2018 and the first half of 2019 were clinical trial cases.
These cases imply that Medicare reimbursement has been inadequate, encouraging providers to refer patients to clinical trials in which the cost of the therapy is often covered by the manufacturer. Given that access to clinical trials can be challenged by factors such as trial location and eligibility, this approach is not sustainable. A bias towards clinical trials also limits patient geographic access as relatively few hospitals have clinical trial capabilities. If clinical trials persist as a large portion of all CAR T-cell cases, reimbursement may fail to improve. According to ASTCT, a high volume of clinical trial cases had total charges that were only 15 percent of total charges submitted by non-clinical trial cases. The average total charge in clinical trials was only 22% of non-clinical trial charges. These clinical trial charges are not representative of non-clinical trial cases since they do not include the product charge. MS-DRG 016 payment, which will incorporate these clinical trial costs, is not expected to reflect non-clinical trial costs in upcoming years.
Inadequate Medicare IPPS reimbursement for CAR T-cell therapies may be producing unintended geographic barriers to patient access. Few centers can recoup the costs of these therapies or have the infrastructure to endure reimbursement losses. Improving equitable access to these innovative therapies will require adaptive reimbursement mechanisms. Bear in mind Congress’ chief objectives in creating the IPPS:21
To ensure fair compensation for services rendered and not compromise access to hospital services, particularly for the more seriously ill;
To ensure that the process for updating payment rates would account for new medical technology, inflation, and other factors that affect the cost of providing care;
To monitor the quality of hospital services for Medicare beneficiaries; and
To provide a mechanism through which beneficiaries and hospitals could resolve problems with their treatment.
Health care providers cannot be expected to assume sizeable losses on new therapies as they strive to provide promising therapies to their patients. If reimbursement for CAR T does not swiftly adapt, Medicare patients may continue to suffer undue travel burdens and limited access to CAR T-cell therapies.
References
State Cancer Profiles; Incidence Rates Table. National Cancer Institute. https://www.statecancerprofiles.cancer.gov/incidencerates/. Published 2020. Accessed March 2, 2020.
Ambroggi, Massimo, et al. "Distance as a barrier to cancer diagnosis and treatment: review of the literature." The oncologist 20.12 (2015): 1378.
Kelly C, Hulme C, Farragher T, Clarke G. Are differences in travel time or distance to healthcare for adults in global north countries associated with an impact on health outcomes? A systematic review. BMJ Open. 2016;6(11):e013059.
Friedman SA, Frayne SM, Berg E, et al. Travel time and attrition from VHA care among women veterans: how far is too far? Med Care. 2015;53(4 Suppl 1):S15-22.
Chari A, Romanus D, DasMahapatra P, et al. Patient-Reported Factors in Treatment Satisfaction in Patients with Relapsed/Refractory Multiple Myeloma (RRMM). Oncologist. 2019.
Patel M, Periyakoil V, W. D, et al. Redesigning Cancer Care Delivery: Views From Patients and Caregivers. Journal of Oncology Practice. 2017;13(4):e291-e302.
Wage Index | CMS. https://www.cms.gov/Medicare/Medicare-Fee-for-Service-Payment/AcuteInpaDentPPS/wageindex. Accessed March 5, 2020.
Rural Health | CMS. https://www.cms.gov/About-CMS/Agency-InformaDon/OMH/equity-iniDaDves/rural-health. Accessed March 5, 2020.
Crosson F. Report to the Congress: Medicare Payment Policy. Washington, D.C.; 2019. http://www.medpac.gov/docs/default-source/reports/mar19_medpac_enDrereport_sec.pdf. Accessed February 14, 2020.
Manz CR, Porter DL, Bekelman JE. Innovation and Access at the Mercy of Payment Policy: The Future of Chimeric Antigen Receptor Therapies. J Clin Oncol. 2020;38(5):384-387. doi:10.1200/JCO.19.01691
Thompson D. Re: Request for MS-DRG Reclassification for Certain Cases Involving Use of Chimeric Antigen Receptor T-Cell Therapies. Presented at the: 2019. https://46ax7g7nqmq3divu13d9zsn1-wpengine.netdnassl.com/wp-content/uploads/2019/11/CAR-T-cell-MS-DRG-reclassificaDon-request-FY-2021-final.pdf. Accessed March 1, 2020.
Cox E, Nambiar S, Baden L. Needed: Antimicrobial Development. N Engl J Med. 2019;380(8):783-785. doi: 10.1056/NEJMe1901525
Fiscal Year (FY) 2020 Medicare Hospital Inpatient Prospective Payment System (IPPS) and Long Term Acute Care Hospital (LTCH) Prospective Payment System (CMS-1716-F) | CMS. Centers for Medicare & Medicaid Services. https://www.cms.gov/newsroom/factsheets/fiscal-year-fy-2020-medicare-hospital-inpaDent-prospecDve-payment-system-ipps-and-long-term-acute-0. Published 2019. Accessed March 1, 2020.
Majhail N. RE: CMS-1716-P; Medicare Program; Hospital Inpatient Prospective Payment Systems for Acute Care Hospitals and the Long-Term Care Hospital Prospective Payment System and Proposed Policy Changes and Fiscal Year 2020 Rates; Proposed Quality Reporting Require. Presented at the: 2019. https://higherlogicdownload.s3.amazonaws.com/ASBMT/43a1f41f-55cb-4c97-9e78-c03e867db505/UploadedImages/ASTCT_FY_2020_IPPS_Comments_FINAL.pdf. Accessed March 2, 2020.
SEER*Stat Software. National Institutes of Health. https://seer.cancer.gov/seerstat/. Published 2017. Accessed February 23, 2018.
Hartsell A. Emerging Trends in Chimeric Antigen Receptor T-Cell Immunotherapy in Adults from the Vizient Clinical Database. Biol Blood Marrow Transpl. 2019;25:S290-S442. https://www.bbmt.org/acDon/showPdf?pii=S1083-8791%2818%2931366-1. Accessed March 3, 2020.
Types of B-cell Lymphoma. American Cancer Society. doi:10.1007/s11899-016-0357-7
Yin X, Xu A, Fan F, et al. Incidence and Mortality Trends and Risk Prediction Nomogram for Extranodal Diffuse Large B-Cell Lymphoma: An Analysis of the Surveillance, Epidemiology, and End Results Database. Front Oncol. 2019;9:1198. doi:10.3389/fonc.2019.01198
Thompson A. Re: Follow-up to August 30, 2018 Meeting; Proposed CAR-T Coverage and Payment Options.; 2018. file:///C:/Users/sdssn/Downloads/ASBMTASHCART SoluDonsFINAL1112018 v2 (1).pdf. Accessed January 24, 2020.
Majhail N. Re: Options for CAR-T Inpatient Payment for FY 2021.; 2019. Accessed January 24, 2020.
Brady T, Robinson B, Davis T. Medicare Hospital Prospective Payment System How DRG Rates Are Calculated and Updated. San Francisco, CA. https://oig.hhs.gov/oei/reports/oei-09-00-00200.pdf. Accessed March 3, 2020.