Medicare Analytics: Case Study of Part D Coverage Gap Utilization for an Oral Oncology Brand
In this analysis, Qualia Bio analyzed the 2019 Medicare Part D Files (including PDPs and MA-PDs) to assess select Part D population dynamics and utilization patterns for Product X, an FDA approved oral anti-cancer drug.
Background/Methods
Medicare Part D is a voluntary outpatient prescription drug benefit for Medicare beneficiaries. Part D is offered through private companies as a stand-alone prescription drug plan (PDP) to supplement traditional Medicare or a Medicare Advantage prescription drug plan (MA-PD), that cover all Medicare benefits including medical and pharmacy. In 2019, over 48 million of the more than 64 million Medicare beneficiaries were enrolled in plans that provide Medicare Part D coverage.
In this analysis, Qualia Bio analyzed the 2019 Medicare Part D Files (including PDPs and MA-PDs) to assess select Part D population dynamics and utilization patterns for Product X, an FDA approved oral anti-cancer drug.1 Variables of interest in this study include low-income subsidy patient mix and distribution of Product X claims by specific phase of the Part D benefit design. These variables were chosen to understand how they may affect government-mandated discounts in Medicare Part D for Product X.
Findings
Part D Low-Income Subsidy
The Medicare Part D Low-Income Subsidy (LIS) program helps beneficiaries pay for prescription drugs and lowers the costs of Medicare prescription drug coverage. CMS is required by statute to update the Part D resource limits, income standards, and cost sharing amounts for the low-income subsidies each year. In 2019, LIS program provided premium and cost-sharing assistance for Part D enrollees with low incomes (less than 135% of poverty, $16,862 if single or $22,829 if married).
In our analysis, Product X accounted for a slightly lower percentage of LIS beneficiaries when contrasted with Part D (25% versus 29%, respectively as seen in Figure 1). Medicare Part D beneficiaries who receive the LIS are not subject to the coverage gap benefit design and claims attributed to these members do not incur mandated rebate liabilities on the part of the biopharmaceutical manufacturer.
Figure 1. Medicare Part D LIS Distribution by Part D and Product X Beneficiaries, 2019 a-c
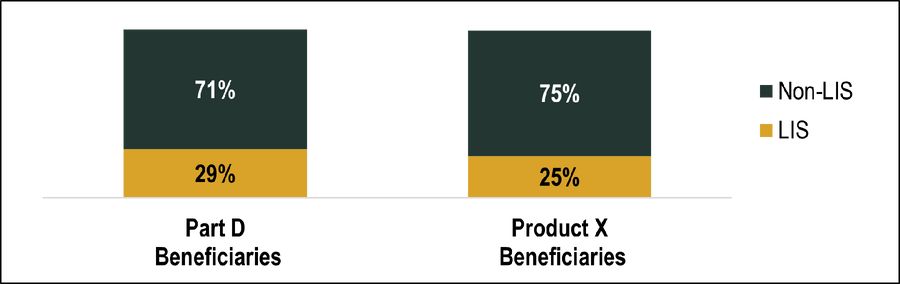
a Part D drug information obtained from the Part D Prescription Drug Event (PDE) data. Part D PDE records were summarized by drug by linking National Drug Codes (NDCs) available in the PDE data and aggregated across all strengths, dosage forms, and routes of administration. All Part D organization and plan types are included. Analyses with fewer than 11 claims are excluded due to CMS restrictions. b Low-income subsidy (LIS) claim defined as Part D claim with LIS amount greater than $0 (Part D benefit requires enrollees to pay both premiums and cost-sharing, but the program also has a low-income subsidy (LIS) that covers some or all of those costs for certain low-income individuals, including deductibles and cost-sharing during the coverage gap). c Part D Low-income subsidy (LIS) beneficiaries includes beneficiaries with full or partial subsidies.
Part D Benefit Phases
There are four coverage phases for Medicare Part D: a deductible phase, an initial coverage phase, a coverage gap phase, and catastrophic coverage phase as depicted in Figure 2 below. Depending on the phase of coverage a beneficiary is in during any given month will determine who (enrollee, plan, manufacturer, and/or Medicare) is liable for the cost of the prescription drug.
In 2019, the standard deductible was $415, the initial coverage limit was $3,820, and the out-of-pocket spending threshold was $8,410 (corresponding to an out-of-pocket threshold for catastrophic coverage of $5,100).
Figure 2. Standard Medicare Part D Benefit Design, 20191
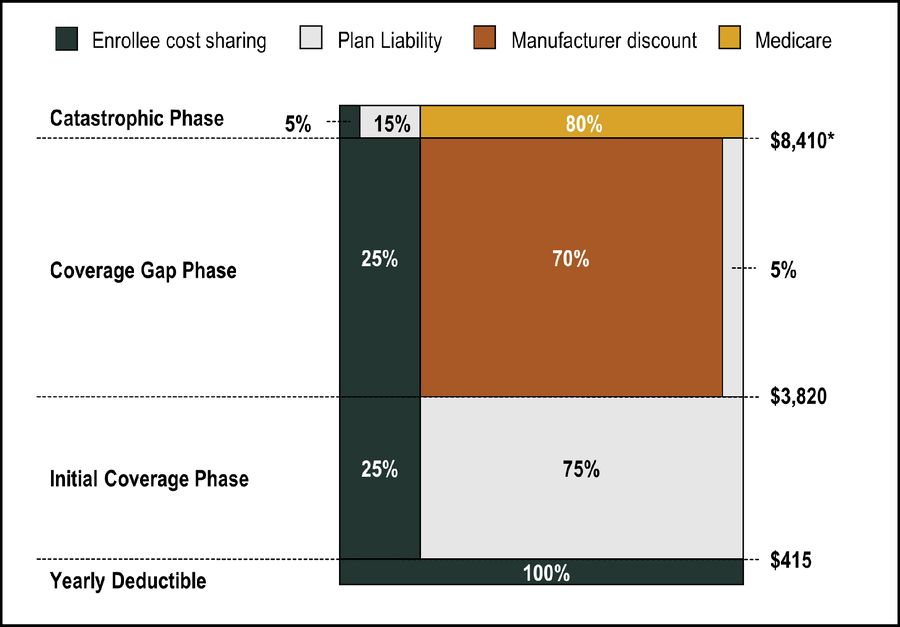
Share of costs in coverage gap reflect costs for brand-name drugs. Coverage gap discount is for brand drugs only and OOP cost share amounts differ for LIS beneficiaries. *Corresponds to an out-of-pocket threshold for catastrophic coverage of $5,100
Biopharmaceutical manufacturers incur a government-mandated 70% discount liability for all brand drug claims which fall into or straddle the coverage gap in Medicare Part D for non-LIS beneficiaries. As such, it is important for manufacturers to understand the volume of these claims to accurately accrue for and forecast coverage gap discount liabilities.
In 2019, over 64% of Product X claims fell within the catastrophic coverage phase with the other approximately 36% of claims incurring a CMS mandated rebate liability (Figure 3). On a monthly basis, more than half of monthly Product X claims fell into the catastrophic phase of Part D benefit design beginning in the month of February (figure 4). Total manufacturer discounts for Product X Part D claims incurring a CMS mandated rebate liability were just under $5 million dollars (Figure 5).
Figure 3. Distribution of Product X Claims by Part D Benefit Phase, 2019
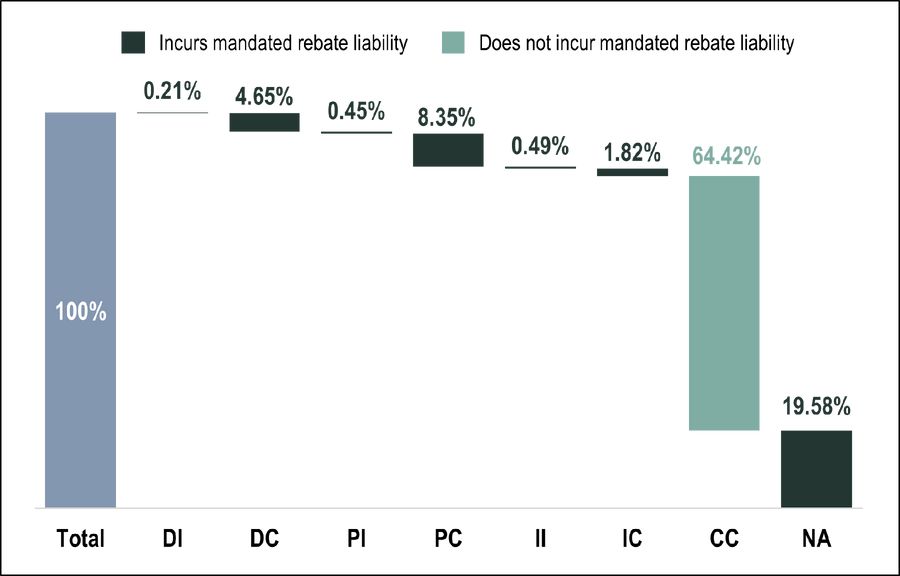
Benefit Phasea: DI, Straddled deductible and ICL (coverage gap) phases; DC, Straddled deductible and catastrophic phases; PI, Straddled pre-ICL and ICL (coverage gap) phases; PC, Straddled pre-ICL and catastrophic straddle phases; II, Coverage gap; IC, Straddled ICL (coverage gap) and catastrophic phases; CC, Catastrophic phase; NA, Beneficiary enrolled in PACE or employer-sponsored plan
a CMS- derived field that indicates the benefit phase in which the prescription likely occurred. This is done by ordering the beneficiary's claims by their dates of service and then comparing the cost of those Part D claim to the benefit structure for the beneficiary’s plan. CMS creates this variable based on the beneficiary’s plan benefit package at the time of the prescription was filled (using the Part D contract). For a small number of beneficiaries, particularly those who changed plans around the time of the fill, the variable may not be accurate. Benefit phase categories with <11 claims were excluded due to CMS restrictions. PACE: Program of All-Inclusive Care for the Elderly (PACE) Managed Care Plan
Figure 4. Distribution of Product X Claims by Part D Benefit Phase by Month, 2019
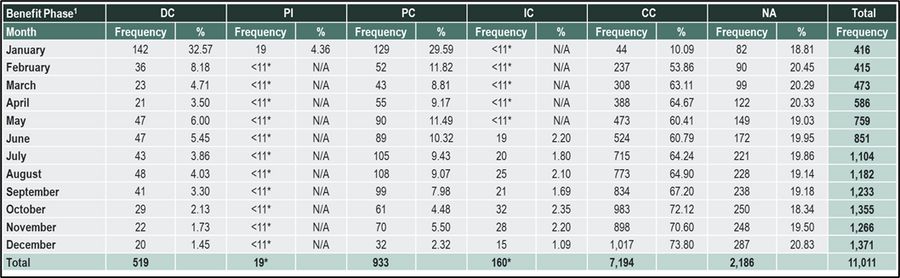
Benefit Phase: DC, PDE straddled deductible and catastrophic phases; PP, Pre-ICL phase; PI, Straddled pre-ICL and ICL (coverage gap) phases; PC, Straddled pre-ICL and catastrophic straddle phases; IC, Straddled ICL (coverage gap) and catastrophic phases; CC, Catastrophic phase; NA, Beneficiary enrolled in PACE or employer-sponsored plan (PACE: Program of All-Inclusive Care for the Elderly (PACE) Managed Care Plan)
1CMS- derived field that indicates the benefit phase in which the prescription likely occurred. This is done by ordering the beneficiary's claims by their dates of service and then comparing the cost of those Part D claim to the benefit structure for the beneficiary’s plan. CMS creates this variable based on the beneficiary’s plan benefit package at the time of the prescription was filled (using the Part D contract). For a small number of beneficiaries, particularly those who changed plans around the time of the fill, the variable may not be accurate. Benefit phase categories with <11 claims excluded due to CMS restrictions (DI, II).
*Monthly benefit phase category with <11 claims excluded due to CMS restrictions
Figure 5. Total Manufacturer Discount Among Part D Product X Claims, 2019a
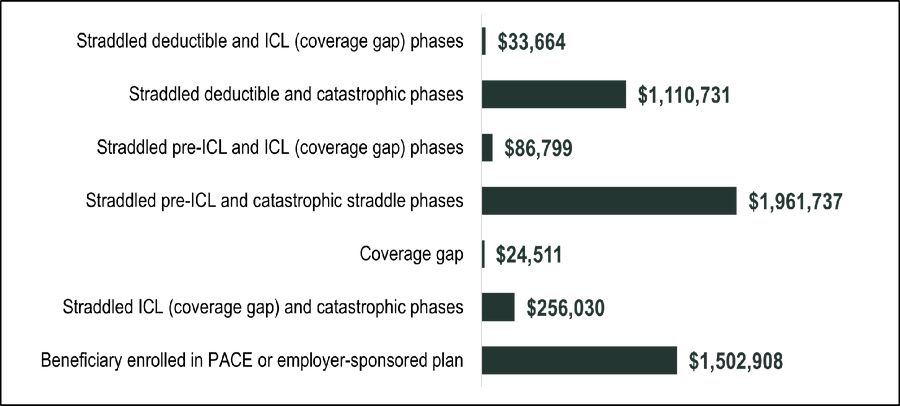
a Total Medicare Coverage Gap Discount ($) based on amount of the discount provided by the drug’s manufacturer under the Medicare Coverage Gap Discount Program, as calculated by CMS based on data reported in the Part D Event File.
Implications for Life Science Organizations
Qualia Bio’s Medicare Analytics service provides manufacturers with a resource to inform brand planning related to Medicare Part D utilization and related beneficiary characteristics.
The approach used in this project was specific to Medicare Part D coverage gap analytics. Using a claims-based analysis, Qualia Bio was able to help a client accurately project future coverage gap liabilities based on analysis of an analog brand with similar demand characteristics.
Coverage gap analytics represent a narrow segment of our overall Medicare Analytics service. With access to a database which includes Medicare Part A and Part B claims in addition to Part D, Qualia Bio can deliver comprehensive analysis for any of your brands which may be subject to utilization within the Medicare population.
Conclusion/Action Steps
Through analysis of coverage gap claims, Qualia Bio was able to define the specific coverage gap discount liability for Product X. This approach provided our client with accurate data inputs used in financial modeling of estimated coverage gap liabilities for a product of interest to internal stakeholders.
For more information, or to arrange for a complimentary 30-minute webcast regarding our Medicare Analytics offerings, please contact [email protected]